30min Novice
Very early in the morning on August 6, 2007, ten men were mining coal in Crandall Canyon Mine in Utah. Suddenly, the roof collapsed killing six miners. The imploding earth released so much energy that one of the miners who escaped said that the air rushing past him in the tunnel almost pushed over his pickup truck.
The owner of the mine emphatically maintained that an earthquake caused the collapse. His claim might have remained uncontested, but that day hundreds of USArray seismometers were recording ground motion in the western US. They recorded the ground motion that resulted from the seismic waves released at the time of the collapse. Seismologists analyzed the direction of the first arrivals, P-Waves, to determine if they they start as a crest or a trough. In addition, they also compared the seismograms from this event to seismograms from smaller earthquakes in the past to build a mathematical model for the forces and ground motion this event.

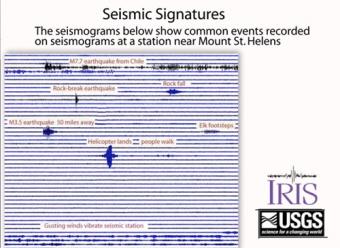
Seismograms of common events are compiled to show the different seismic signals recorded by ground-shaking events. Seismograms can record everything from nearby earthquakes to earthquakes on the other side of the world, plus anything that shakes the ground near the seismograph station like people walking, elk running, rocks falling and helicopters landing.

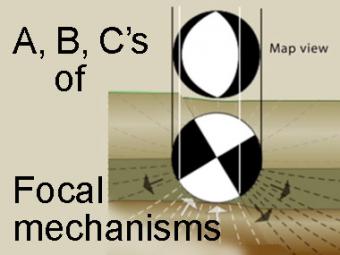
The focal mechanism of an earthquake is represented by a “beachball” diagram. These are released after an earthquake to illustrate the type of faulting produced the earthquake. This difficult concept is carefully explained using strike-slip, normal, and thrust faults.
GIFS for select segments included as optional download.
We encourage the reuse and dissemination of the material on this site as long as attribution is retained. To this end the material on this site, unless otherwise noted, is offered under Creative Commons Attribution (CC BY 4.0) license